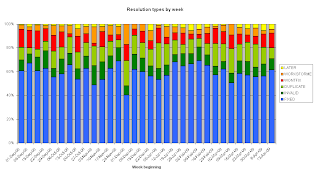
Last November I put together some simple charts with the information from the weekly bug statistics that are automatically generated for the wikitech-l mailing list. There's now thirty-two weeks of data available, so here are some updated charts.
The distribution of resolution types seems to have stayed more or less the same over time, continuing the pattern seen in the original charts:
However, there are some changes in the other graph, which is based on information about the number of bugs each week. It shows the number of new, reopened, assigned and resolved bugs each week (using the scale on the left) and the total number of open bugs (in blue, using the scale on the right):
While there is still the same rough correlation between the number of new bugs and the number of bugs resolved each week, there is also a steady trend upwards in the total number of open bugs. Indeed, the total has risen nearly 20% since October last year.
So what are the consequences of so many bugs being opened but not dealt with? The following chart, generated by Bugzilla directly, shows the distribution of the "severity" parameter of all currently open bugs:
It shows that three-fifths of open bugs have severity given as "enhancement", essentially meaning that they're feature requests, entered into Bugzilla for tracking purposes, rather than being true bugs. A further 13% are marked "trivial" or "minor", and nearly a quarter "normal"; only 3% are "major".
So while the number of unresolved bugs is steadily rising, most of these are either feature requests or only minor bugs. Still, the backlog is fairly steadily getting worse, a reminder that it's constantly necessary for new volunteer developers to become involved with improving MediaWiki.
Monday 20 April 2009
More bug statistics
Posted by
Stephen
at
11:55 pm
1 comments
![]()
Labels: bugs, statistics
Subscribe to:
Posts (Atom)


